The Pilgrim’s Office of the Cathedral of Santiago de Compostela publishes every morning the daily pilgrim arrivals in Santiago the previous day. In the statistics section, the aggregate data are shown, so it is necessary to work a little on the data to see them distributed by days.
Daily arrivals
Here are the daily arrivals of pilgrims to Santiago since 2020. Below you can see the distribution by Camino and departure city of the pilgrims who have requested the Compostela on a given day.
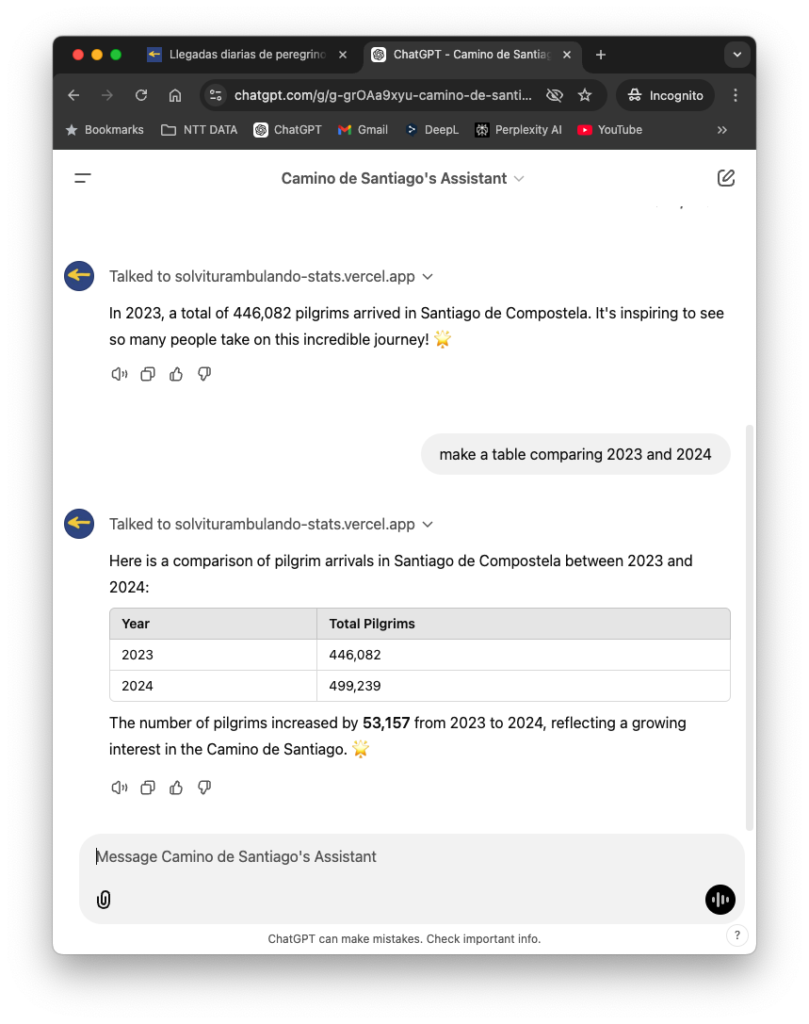
Do you want to try using ChatGPT to ask about statistics and everything you can think of about El Camino (routes, tips, hostels, statistics, …)? You just need to be registered with a free account.
More than 600 people have already tried it. Let me know what you think in the comments.
Daily arrivals distribution
Here is the breakdown of daily arrivals by Path, Country and Origin since 2020. This way you will be able to know where pilgrims from a certain country started their pilgrimage. Of course, these are interactive graphs so you can explore the data.
As you can see if you take a look at the statistics of the official website of the Cathedral of Santiago, this type of analysis is not offered so you can only see it here.
If you would like to have other combinations by Age, Reason, … leave me a comment and I will update it.
Statistics Camino de Santiago
As you know, I also have available the comparative visualizations of statistics provided by the Office. Take a look and draw your own conclusions.
If you want, you can also see the results of the survey I have active for pilgrims (and fill it out if you have a few minutes).
Sources and data
The data are collected from the Pilgrim’s Office of the Cathedral of Santiago de Compostela on its home page.


Great stats page. I love it.
Mark from
Followtheyellowshell.com
Thank you Mark!!
Thank you
I’m glad you like it ☺️
Solvitur,
An excellent page, thank you for the great Statistics.
If you could add age graph would be great.
Many Thanks,
Rob
My brother and myself never bothered with a certificate so I assume we and others are not counted in the statistics? Greetings Joe from Australia
Yes… you’re right. The statistics only take into account those who have requested the Compostela or the distance certificate. It’s also my case on one of the occasions 🙂
I’ll do. Thank you for the feedback!!
Hi Solvitur,
Great webpage and insights into the Camino! I’m currently in search of data to create an engaging Data Visualization portfolio. I noticed the defunct API from the cathedral in Santiago and it seems like you have tapped into a different source. Could you help me out by sharing where you get your data from? I’m struggling to find a source that provides current data.
Many thanks in advance and greetings from Cologne
Hi David,
I gather the data from the statistics page of the Pilgrim’s Office although now that they have changed to PowerBI, it makes me do it almost manually. For updated arrivals data, I use the Pilgrim’s Office home page which is updated almost in real time.
Best,
Excellent website, that’s exactly what I’ve been looking for for a long long time. Thank you very much. Keep up the fantastic work!
Tim! Thank you very much for your feedback! 😊
If you want to see other dimension analysis, let me know. I’m thinking also to provide an API with the info by day… I’ve just tested it with an iOS Shortcut
Great data. Thank you. Any chance you could add a path slicer to the top graph? Would be interesting to see a year over year comparison for each path individually.
Thank you Kevin. You can explore aggregated data by Camino here: https://solviturambulando.es/en/el-camino-de-santiago/camino-de-santiago-stats/
Let me know if you are thinking in something different.
I really appreciate your making these statistics available. I see the info from 9/15 is missing. Any chance you can add it.
Done! 2430 pilgrims that day
Hello there! I am Greek and did the Camino inglés from 22/9/24 to 27/9/24. I don’t see any Greeks on those days (including me) in the statistics. I would be grateful if you have extra information! Ultreia!
Hi Elisavet, did you ask for the Compostela when you arrived?
If you did, let me know the day and I’ll check it because in the dashboard I just show the top 15 countries for that period of time.
In any case, I’ll review it and I’ll contact you by email.
Thank you for your comment and Buen Camino!
I am wondering if something has happened to you. The Dail6 Arrivals Distribution seems to not. Be updated for the last 3 days. I love being able to easily see a breakdown between the routes.
Hi Steven, I’ve been traveling a lot. Let me check if I can solve it.
Thank you Javier. I really appreciate the time and effort you spend making this information available.
An unexpected update in the database engine. I’m working on it. Sorry for the inconveniences
I think it’s solved but there are some updates in the hosting server that I need to include… let see the following days.
Javier,
I thought I leave a message to say Thank you again. Everytime my friend ask me whether they should book albergues in advance, which month they should go? I always come here to consult the data. Show them the data, ask them to decide for themselves, what they think is best todo.
Thank you so much for your comment. I love knowing that it’s useful to you.